Better Rails debugging with pry

Pry is an interactive console, like IRB, which can be used to pause execution and inspect the current scope in your Rails web requests or tests. I'm going to show you how simple it is to drop it into your Rails apps and get better visibility over bugs.
Install pry
Simply add this to your Gemfile:
group :development, :test do
  gem "pry"
end
and run bundle install. Adding it to the development and test groups means that it you'll be able to use it when debugging in the browser and when running the test suite.
Debugging the rails server
You can insert the line binding.pry wherever you want in your rails app, and when you visit a URL that hits that line, the interactive Pry console will appear within the rails server output.
For example:
class UsersController
  def index
    #  Something's gone wrong here, so I want to debug
    binding.pry
    @users = User.all
  end
end
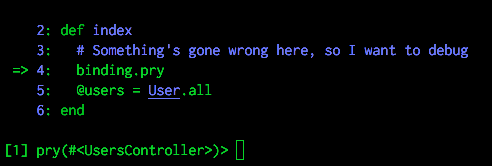
The rails console will show something like the following:
 You can execute any ruby code in the current scope
Since you can execute any ruby code in the current scope, you can debug local variables, check the contents of the database using ActiveRecord models and even modify variables. There's a huge amount you can do with pry: check the wiki for more information.
When you've finished, just type exit to carry on with the execution of your code.
Debugging tests
This is where I've found pry to be the most useful. You use it in exactly the same way, i.e. put binding.pry wherever you want, and the Pry console will appear when you run rake. If you use guard then it will show inside the guard console.
This is incredibly useful for acceptance/integration tests, where sometimes it can be hard to get a picture of what's going on in a complex system. Bugs are common and often hard to debug when using headless browsers, and even swapping to a visual browser doesn't make it that easy. Pausing test execution with binding.pry allows you to get a good picture of what's going on. For instance, you can run Capybara queries inside the pry console, to find out why they're failing in your tests.
Adding fine-grained debugging control
If you're looking for more control over debugging, such as being able to step through code, you can add the pry-byebug gem. This extends to functionality of pry to add these commands, allowing you to move between stack frames easily.


